
|
|
|
| Medawar Market Musings | November 2024
|
|
|
|
|
|
|
|
|
|
From the NWMLS:
Unsettled mortgage rates prolong uncertainty in the market - Northwest Multiple Listing Service
Published on: November 6, 2024
Northwest MLS, the source for the most current, accurate market listing data in Washington state, today released its Market Snapshot for the month of October 2024.
Market Recap
Closed sales increased by over 11% month-over-month, driven by a brief downturn in mortgage rates and a boost in buyer confidence amid hopes for continued rate declines. However, mortgage rates unexpectedly rose again from 6.08% at the end of September to 6.72% at the end of October. This increase correlates to economic data including strong job growth numbers but presents challenges for hopeful buyers. Meanwhile, home prices increased by 2.4% month-over-month on average, further dampening optimism.
“The only thing that seems certain about this market is that houses are not becoming more affordable, due to the ongoing combination of high interest rates and rising prices,” said Steven Bourassa, director of the Washington Center for Real Estate Research (WCRER) at the University of Washington.
October 2024 Key Takeaways
Active Listings
-
While the total number of properties listed for sale declined by about 6% when compared to last month, there was a 29.8% increase when compared to the same month last year, with 14,795 active listings on the market at the end of October 2024 compared to 11,403 at the end of October 2023.
-
The five counties with highest increases in active inventory for sale were Grant (+54.6%), Pacific (+48%), Clallam (+42.5%), Chelan (+40.9%) and Lewis (+35.6%).
Closed Sales
-
The number of closed sales increased by over 11% when compared to last month, and by 22.5% when compared to the same month last year – 6,479 in October 2024 compared to 5,291 in October 2023. An increase in the number of closed sales year-over-year was observed in 22 out of 26 counties.
-
The total dollar value of closed sales in October 2024 was $4,766,092,472 for residential homes and $499,012,797 for condominiums, for a total value of $5,265,105,268. The total value in October 2024 saw an increase of 33.4% when compared to October 2023.
Median Sale Price
-
Overall, the median price for residential homes and condominiums sold in October 2024 was $650,000, an increase of nearly 8% when compared to October 2023 ($602,000). When compared to last month, the median price increased 2.4% from $635,000 in September 2024.
-
The three counties with the highest median sale prices were King ($865,000), San Juan ($825,000) and Snohomish ($753,000), and the three counties with the lowest median sale prices were Ferry ($112,500), Pacific ($330,625) and Grant ($341,782).
Consumer and Broker Activity
NWMLS also provided insights into consumer activities during the month of October 2024:
-
In September 2024, there were 17,049 listed properties that were eligible for the Down Payment Resource (DPR) program offered by NWMLS, a 23% year-over-year increase of 23% from October 2023.
-
Keyboxes located at listed properties were accessed 146,608 times in October 2024, a 7% decrease in activity from September 2024 when they were accessed 157,756 times. However, keybox activity increased by 16% year-over-year, with keyboxes being accessed 126,029 times in October 2023.
-
The total number of property showings scheduled through NWMLS-provided software decreased 8% from 119,900 in September 2024 to 110,736 in October 2024. This was a year-over-year increase of 18% from the number of showings in October 2023 (93,707).
|
|
|
|
|
|
|
|
|
|
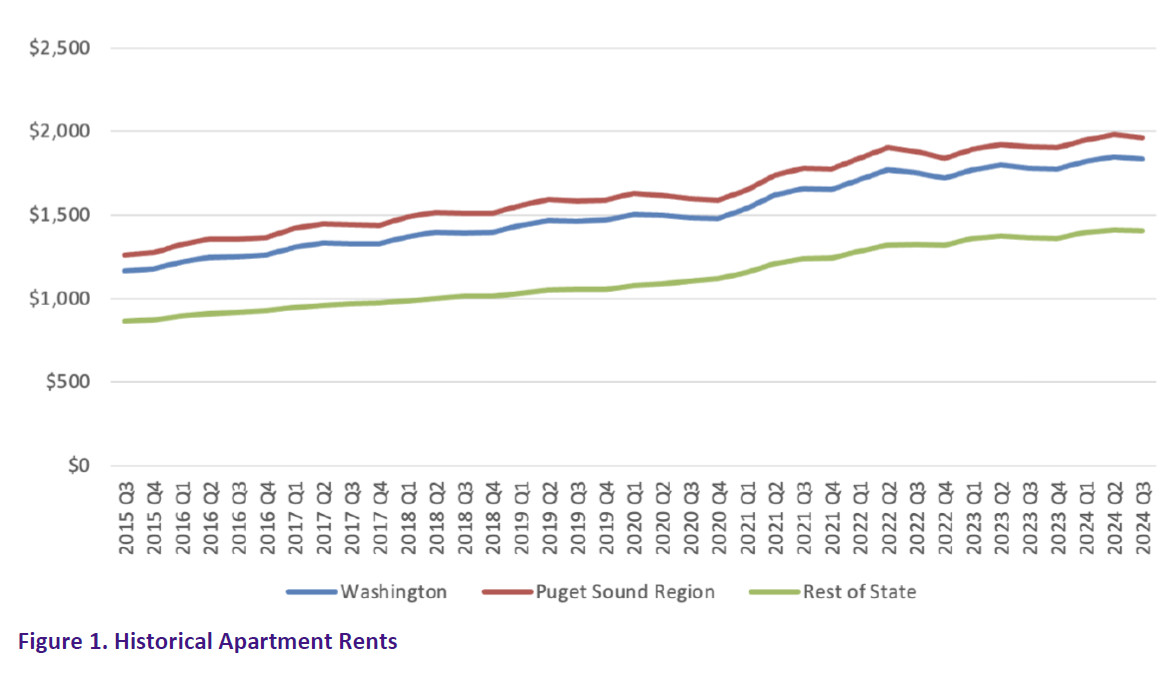
Rent Trends
Apartment rents decreased in the 3rd quarter 2024 (see Figure 1). Rents decreased by 0.87% on average across the state, 0.96% in the Puget Sound region, and 0.28% in the rest of the state.
The current statewide annual rate of rent growth is 2.86%; this means that average rent levels for the 3rd quarter 2024 were 2.86% higher than those for the 3rd quarter 2023. The annual growth rate for the Puget Sound region was 2.83%, while that for the rest of the state was 3.23%.
|
|
|
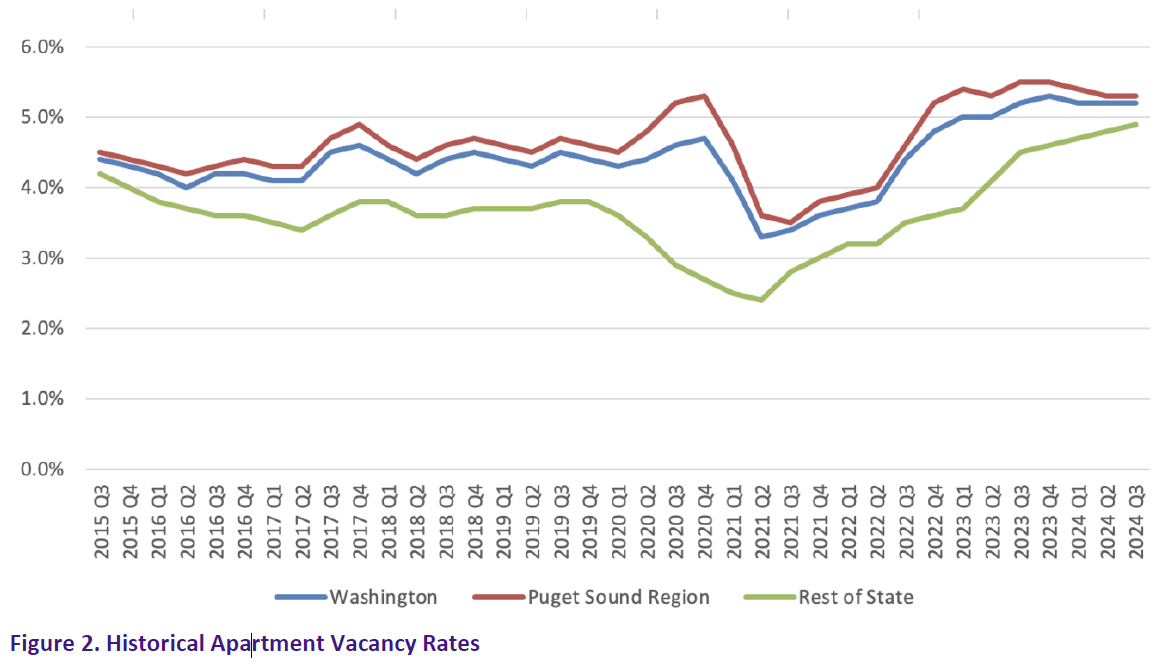
Vacancy Rate Trends
Figure 2 shows that vacancy rates were virtually unchanged during Q3 2024 statewide and in the Puget Sound region, but increased slightly elsewhere in the state. The current statewide vacancy rate is 5.2%, which is 0.2% higher than vacancy rates a year earlier and unchanged relative to the previous quarter. The gap between the average vacancy rates in the Puget Sound region and the rest of the state has decreased slightly; those regions currently have vacancy rates of 5.3% and 4.9%, respectively. For all the periods shown, vacancy rates in the Puget Sound region have been higher than elsewhere in the state. Year-over-year, vacancy rates were unchanged in the Puget Sound region and increased 0.7 percentage points elsewhere in the state.
|
|
|
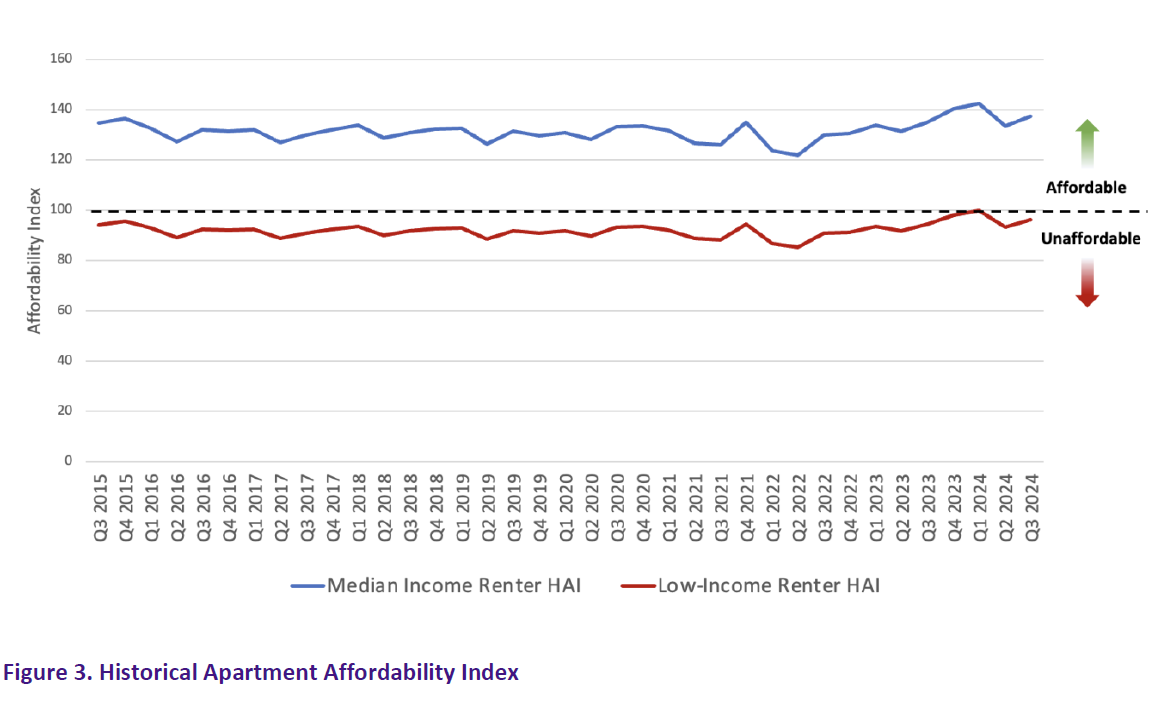
Apartment Affordability Trends
Figure 3 shows two housing affordability indexes (HAIs), both based on average rents for apartments across the state. One index assumes a moderate-income household with median income, while the other assumes a low-income household with income at 70% of the median. In both cases, it is assumed that a household can afford to spend no more than 30% of income on rent. Affordability improved somewhat during Q3 2024, due to drops in rent levels and increases in household incomes.
As the graphs indicate, an apartment with average rent has consistently been affordable for a household with median income. Such an apartment has generally not been affordable for a household with 70% of the median, although the income gap has not been large for that group. Moreover, the lower-income group can afford somewhat less expensive apartments. The relatively consistent affordability levels over time are evidently due to growth in the supply of apartments combined with growth in household incomes.
|
|
|
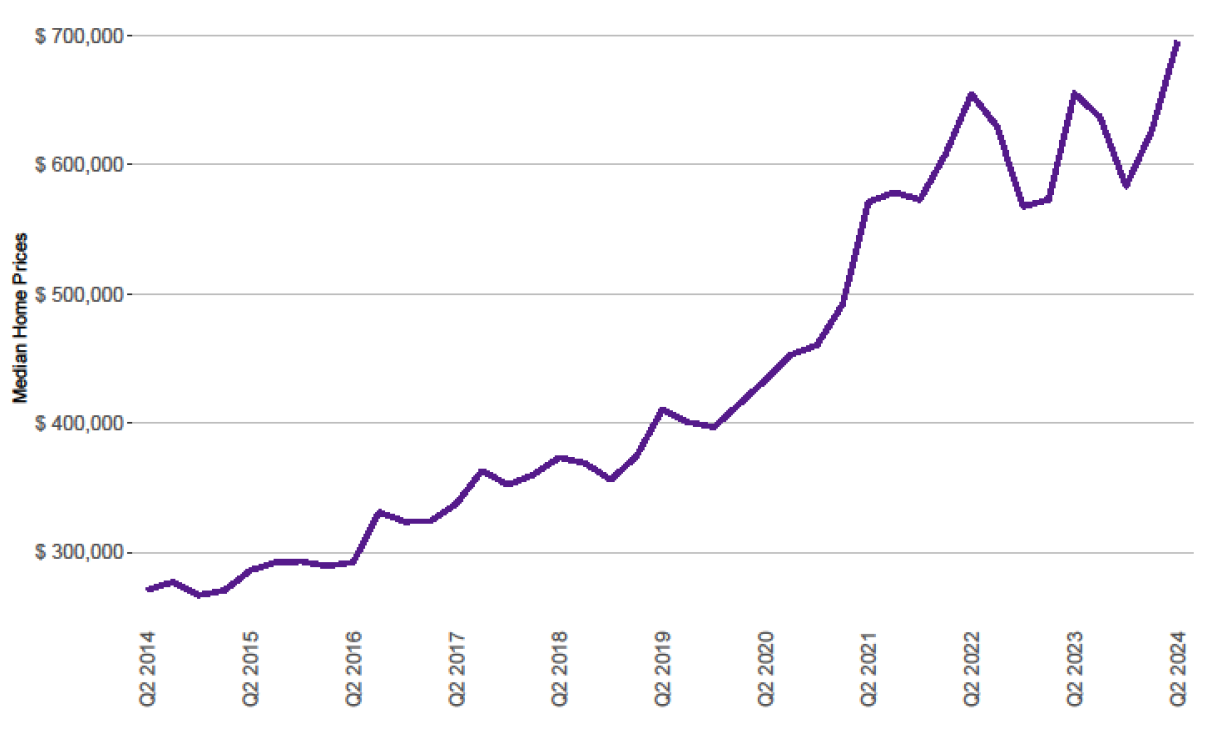
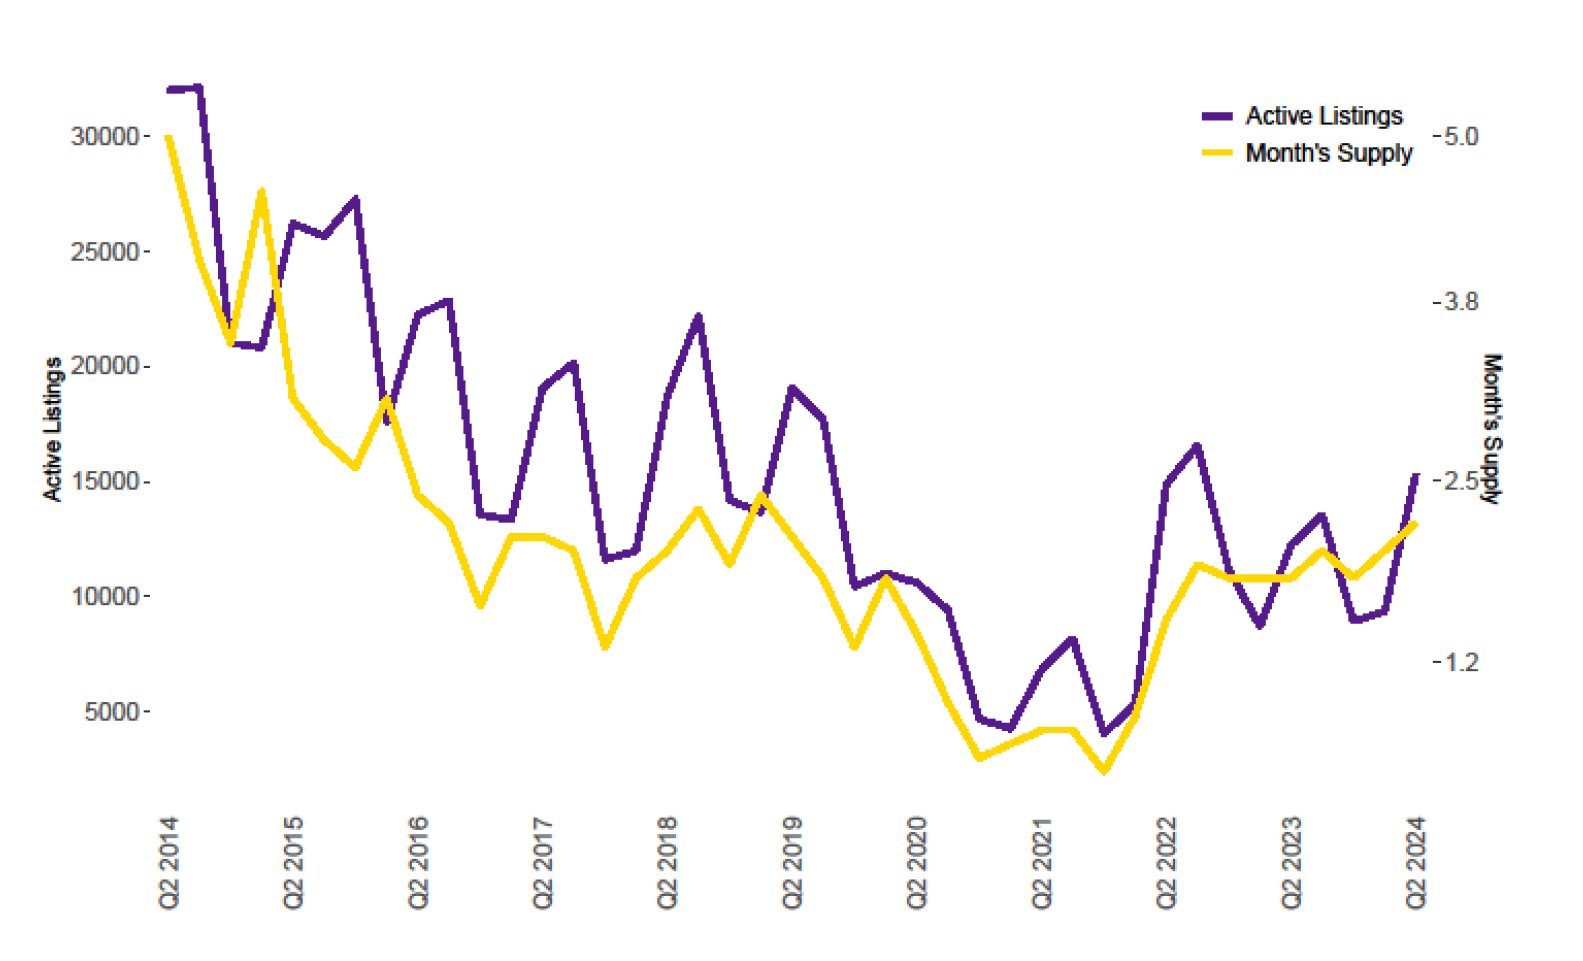
Housing Prices and Supply
Chris Medawar Commentary:
While apartment rents continue to become more affordable housing prices have continued the opposite trend. Inventory is rising and has reached levels last seen in 2019, but is nowhere near the last buyer’s market in 2010-2014. A persistent seller’s market despite rising interest rates has continued to push home prices higher and made renting a much more attractive option for many would be buyers.
|
|
|
|
|
|
|
|
|
|
|
|
|
|